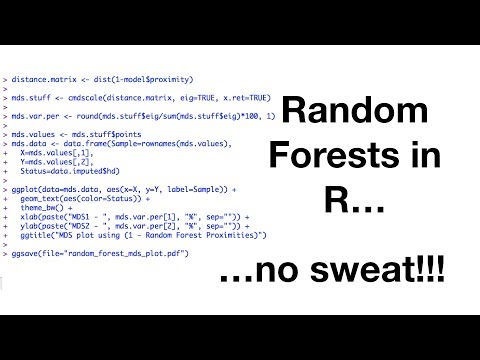
Random forests are a powerful machine learning technique used for decision-making, classification, and regression tasks. In this guide, we will explore how to build, use, and evaluate random forests in R, a popular programming language for statistical analysis.
Contents
Introduction
Random forests provide a robust and accurate method for predictive modeling. They combine multiple decision trees to make predictions, reducing the risk of overfitting and improving the model’s generalization ability. In this guide, we will dive deep into the steps involved in building, using, and evaluating random forests in R.
Loading Libraries
Before we begin, let’s load the necessary libraries. We’ll be using ggplot2 for data visualization and randomForest for building random forests.
library(ggplot2)
library(randomForest)
Loading the Dataset
For demonstration purposes, we’ll use the Heart Disease dataset from the UCI Machine Learning Repository. This dataset contains information about various risk factors associated with heart disease.
To load the dataset, we can use the following code:
heart_data <- read.csv("heart_disease.csv")Exploring the Dataset
Let’s begin by examining the structure of the dataset and making any necessary adjustments. We start by using the head() function to display the first few rows of the dataset:
head(heart_data)Next, we check the structure of the dataset using the str() function to identify any inconsistencies or missing values:
str(heart_data)If any columns contain missing values, we can use appropriate techniques, such as imputation or removal, to handle them.
Preprocessing the Dataset
In some cases, we may need to preprocess the dataset before building the random forest. This includes tasks such as converting categorical variables to factors, handling missing values, and normalizing or standardizing numeric variables.
For example, to convert a variable called sex into a factor with levels “female” and “male”, we can use the following code:
heart_data$sex <- factor(heart_data$sex, labels = c("female", "male"))Similarly, we can handle missing values by imputing or removing them based on the specific requirements of the dataset.
Building the Random Forest
Now, let’s build our random forest model using the randomForest() function. We need to specify the formula for the model, which consists of the target variable and the predictor variables.
rf_model <- randomForest(target_variable ~ ., data = heart_data)In this example, the target_variable represents the variable we want to predict, and . refers to all other variables in the dataset.
Evaluating the Random Forest
To evaluate the performance of our random forest model, we can use various metrics such as accuracy, confusion matrix, and out-of-bag (OOB) error rate.
# Accuracy
accuracy <- sum(predict(rf_model) == heart_data$target_variable) / nrow(heart_data)

# Confusion Matrix
confusion_matrix <- table(predict(rf_model), heart_data$target_variable)
The OOB error rate provides an estimate of the model’s accuracy using unseen data during training. It can be accessed using rf_model$error.rate.
Fine-tuning the Random Forest
Random forests have several parameters that can be fine-tuned to improve their performance. Two important parameters are the number of trees (ntree) and the number of variables considered at each internal node (mtry).
To find the optimal number of trees, we can plot the error rates for different values of ntree and choose the value at which the error rate stabilizes.
error_rates <- data.frame(ntree = 1:100, error_rate = rep(0, 100))

for (i in 1:100) {
  rf_model <- randomForest(target_variable ~ ., data = heart_data, ntree = i)
  error_rates[i, "error_rate"] <- rf_model$error.rate[length(rf_model$error.rate)]
}

# Plotting the Error Rates
plot(error_rates$ntree, error_rates$error_rate, type = "l", xlab = "Number of Trees", ylab = "Error Rate")
Similarly, we can experiment with different values of mtry to determine the optimal number of variables considered at each internal node.
Conclusion
Random forests provide a robust and accurate approach for various machine learning tasks. In this guide, we explored the process of building, using, and evaluating random forests in R. By fine-tuning the parameters, we can improve the model’s accuracy and make more informed predictions.
To learn more about random forests and other exciting topics in the field of technology, visit Techal.
FAQs
-
What is a random forest?
- A random forest is a machine learning technique that combines multiple decision trees to make predictions.
-
How does a random forest work?
- Random forests use a technique called ensemble learning, where multiple decision trees are built using different subsets of the data. The final prediction is made by aggregating the predictions of all the trees.
-
How do I interpret the confusion matrix?
- The confusion matrix provides information about the model’s performance by comparing the predicted labels with the actual labels. It shows the number of true positives, true negatives, false positives, and false negatives.
-
How do I determine the optimal number of trees for a random forest?
- One way to determine the optimal number of trees is by monitoring the error rates as the number of trees increases. The error rate stabilizes after a certain point, indicating the optimal number of trees.
-
What is the role of
mtryin a random forest?- The
mtryparameter determines the number of variables randomly sampled at each internal node of the decision trees. It controls the level of randomness in the model and helps reduce overfitting.
- The
Have more questions? Feel free to ask in the comments section below!