Are you curious about deviance residuals and how they contribute to assessing how well a model fits the data? In this article, we will dive into the world of deviance residuals and explore their significance in statistical analysis. So let’s get started!
Contents
What are Deviance Residuals?
Deviance residuals are a key component in the evaluation of models, specifically in logistic regression analysis. They represent the square root of the contribution that each data point has to the overall residual deviance. Similar to ordinary least squares residuals, deviance residuals provide insights into how well a model fits the data.
Calculating Deviance Residuals
To calculate deviance residuals, we first need to understand how residual deviance is calculated. Residual deviance is defined as two times the difference between the log likelihood of the saturated model and the log likelihood of the proposed model.
The likelihood of the data given the saturated model is determined by multiplying the likelihoods of each individual data point. The same process is followed for the proposed model. Taking the log of these likelihoods gives us the difference in likelihoods between the two models.
Deviance residuals, therefore, are the square roots of the individual terms. Each deviance residual represents the square root of the difference in log likelihoods for each data point.
Interpreting Deviance Residuals
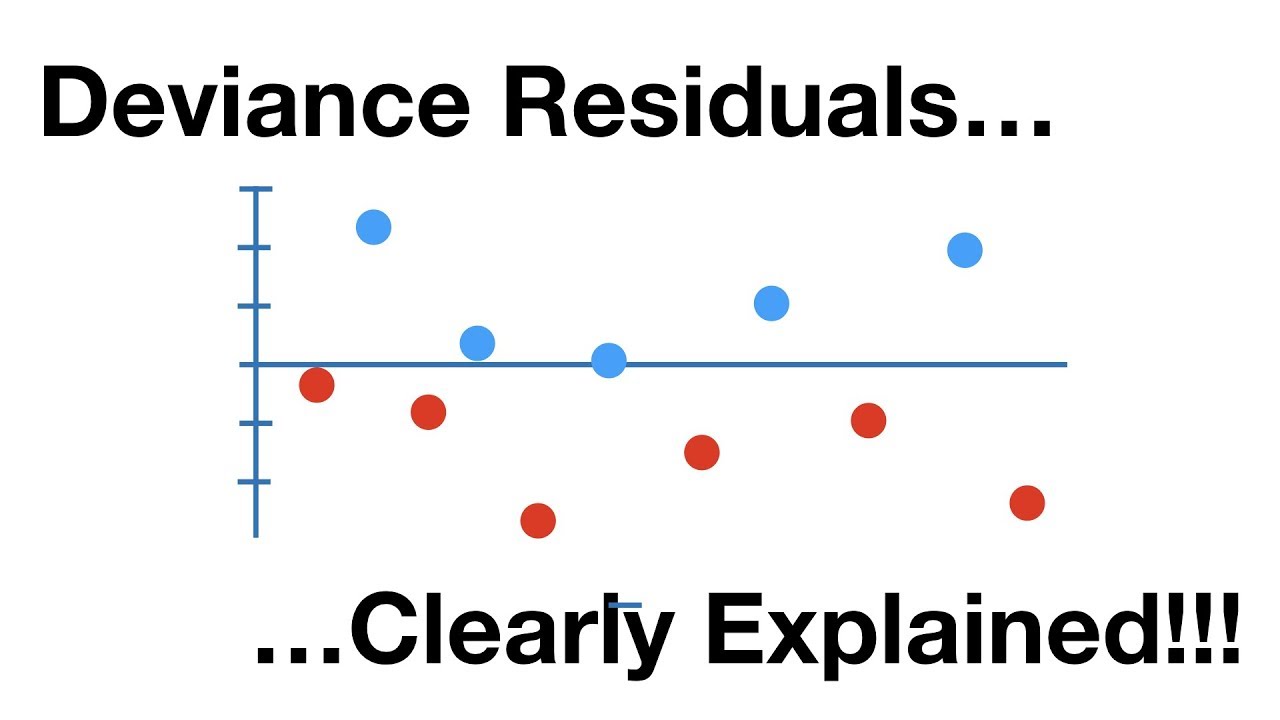
Interpreting deviance residuals helps us identify outliers in our data. Positive deviance residuals indicate that a data point is above the expected range, while negative deviance residuals suggest the opposite.
By plotting deviance residuals on an XY graph, we can visually assess their proximity to zero. Ideally, the residuals should be centered and relatively close to zero. However, if certain deviance residuals are significantly far from zero, it may indicate the presence of outliers.
Identifying and examining these outliers can provide valuable insights into the overall fit of the model and potential errors in labeling or data collection.
Conclusion
Deviance residuals play a crucial role in evaluating the fit of models in statistical analysis. They offer a deeper understanding of how individual data points contribute to the overall residual deviance. By identifying outliers, deviance residuals enable us to fine-tune our models and improve their accuracy.
If you found this article informative, don’t forget to subscribe to Techal for more insightful content. And to support our mission of empowering technology enthusiasts and engineers, consider checking out our original songs. Until next time, keep questing!
FAQs
Q: What are deviance residuals?
A: Deviance residuals represent the square root of the contribution that each data point has to the overall residual deviance in statistical analysis.
Q: How are deviance residuals calculated?
A: Deviance residuals are calculated as the square roots of the individual terms obtained by comparing the log likelihoods of the saturated model and the proposed model.
Q: What do positive and negative deviance residuals indicate?
A: Positive deviance residuals indicate that a data point is above the expected range, while negative deviance residuals suggest the opposite.
Q: How can deviance residuals help identify outliers?
A: By examining the proximity of deviance residuals to zero on an XY graph, outliers can be identified as data points that exhibit significant deviations from the expected range.
For more information, please visit Techal.