Welcome to Techal! In this article, we will delve into the concept of expected values for continuous variables. Whether you are a technology enthusiast or a tech engineer, understanding expected values is crucial in various technological applications. So, let’s explore the world of continuous variables and their expected values!
Contents
Understanding Expected Values for Continuous Variables
Expected values are a fundamental concept in statistics. They provide a way to quantify the average outcome of a random variable. In the case of continuous variables, the outcomes are not discrete but rather continuous measurements. These measurements can be anything from time intervals to physical quantities.
Consider the scenario where you and your friend, Statsquatch, are walking around Statland. Statsquatch wonders how long you would have to wait, on average, to see another person. To estimate this, you decide to keep track of the waiting time for each person you meet.
Modeling Waiting Time with an Exponential Distribution
Since collecting data for an infinite number of intervals is impractical, you need a way to model the waiting time with a continuous distribution. Enter the exponential distribution! This distribution allows you to model continuous variables and their probabilities.

In the exponential distribution, the parameter λ (also called the rate) determines the shape of the curve. By selecting the appropriate λ value, you can fit the distribution to your collected data.
Calculating Probabilities with the Exponential Distribution
Once you have the exponential distribution, you can calculate the probabilities associated with different time intervals. For example, you might want to know the probability of meeting someone within 10 seconds or less.
To determine this probability, you integrate the exponential distribution curve from 0 to 10 seconds. By doing the math, you can find that the probability is 0.39.
Calculating the Expected Value
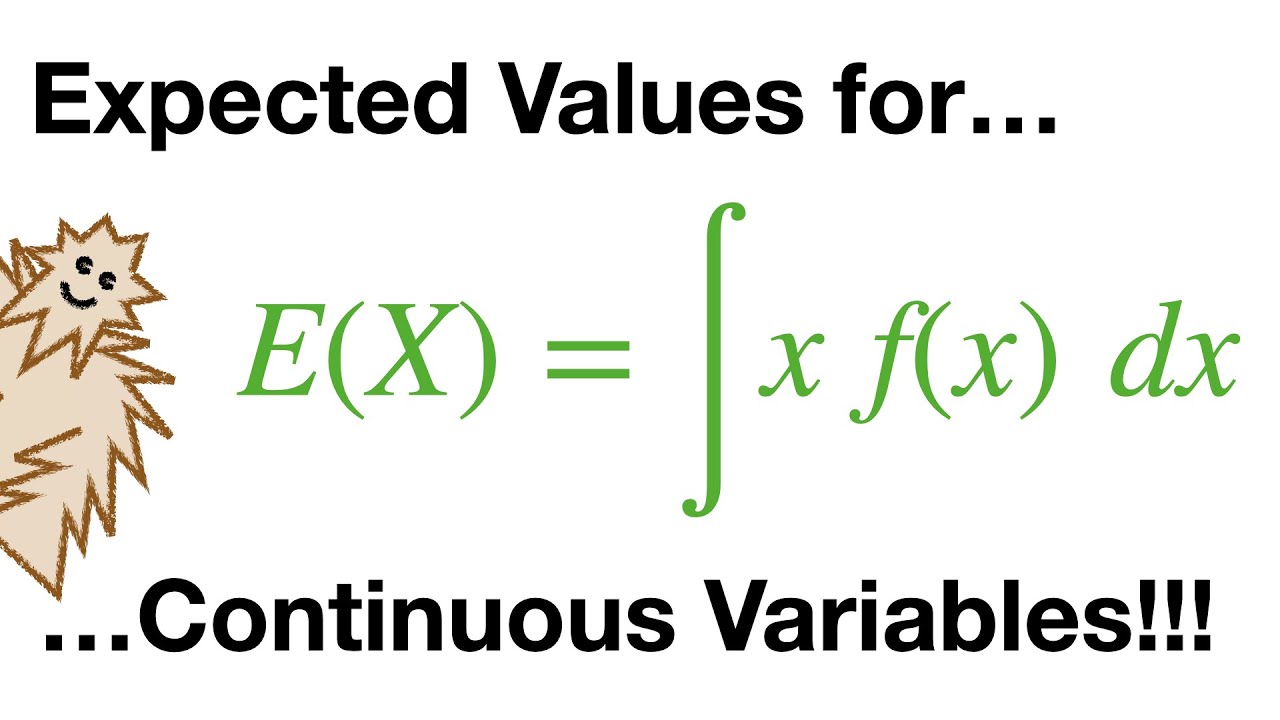
Now that you understand probabilities, let’s move on to calculating the expected value. For discrete variables, the expected value is the sum of the outcomes multiplied by their associated probabilities. Similarly, for continuous variables, the expected value is obtained through integration.
When using the exponential distribution, the formula for the expected value is simply 1 divided by λ. In other words, the expected value represents the average waiting time between each encounter with another person.
Putting It All Together
Let’s consider a specific example. Suppose that λ (the rate) equals 0.05. By plugging this value into the formula, we find that the expected waiting time is 20 seconds. This means that, on average, you’ll expect to wait 20 seconds between each encounter with someone.
FAQs
Q: Is the expected value the same for discrete and continuous variables?
A: Yes, the concept of expected value is the same for both discrete and continuous variables. The only difference lies in the method of calculation: summing for discrete and integrating for continuous.
Q: Can the exponential distribution be used for other continuous variables?
A: Absolutely! While we used the exponential distribution as an example, the formula for expected value can be applied to any continuous variable.
For more information about expected values and their applications, visit Techal.
Conclusion
Understanding expected values for continuous variables is essential in the world of technology. By grasping this concept, you can make more informed decisions and predictions based on continuous data. Whether you’re analyzing waiting times, physical measurements, or any other continuous variable, the expected value will guide you along the way. So, next time you encounter a continuous variable, remember to calculate its expected value to gain valuable insights. Stay tuned for more informative and engaging content from Techal!