Have you ever wondered how to make sense of a large set of measurements? Histograms, my dear tech enthusiasts, provide the answer! In this article, we will delve into the world of histograms and unlock their hidden potential. So, fasten your seatbelts and get ready for an enlightening journey with Techal!
Contents
What Exactly is a Histogram?
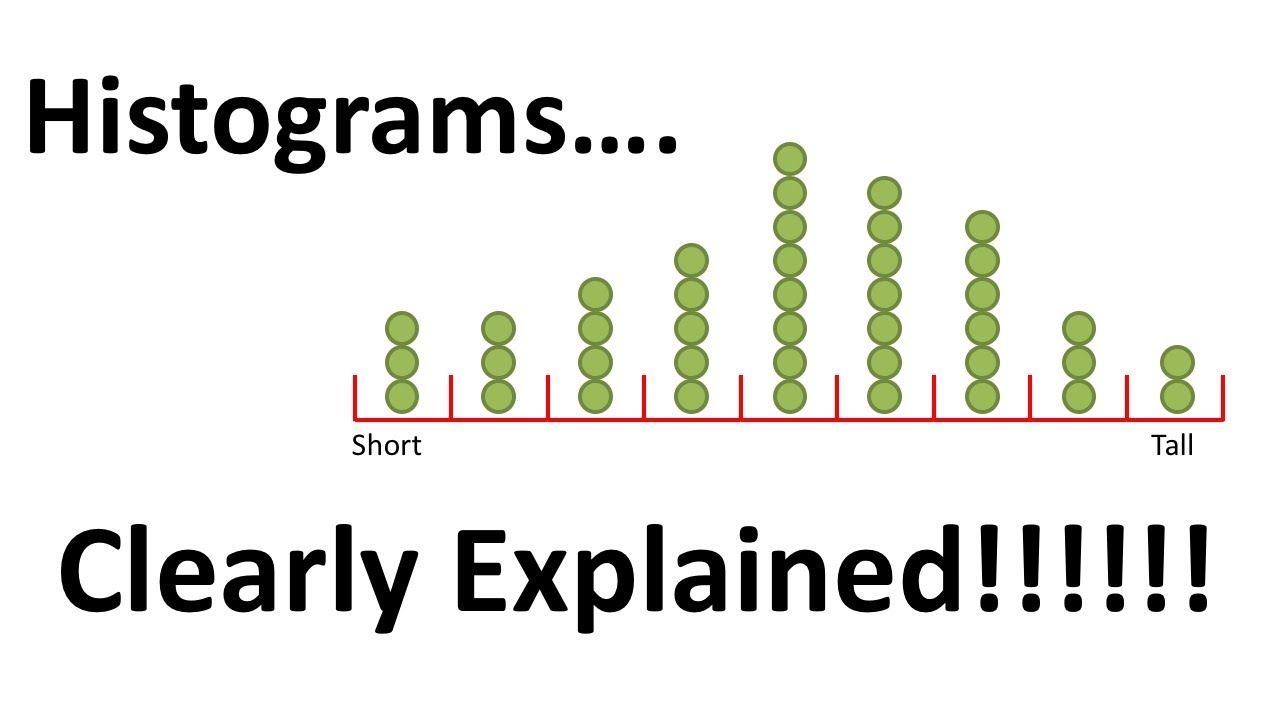
Imagine measuring the height of several individuals. As the number of measurements increases, the dots representing the measurements start to overlap, making it difficult to discern the hidden values. To tackle this challenge, we can divide the range of values into bins and stack the measurements falling into each bin. Voilà! We have ourselves a histogram!

Unveiling the Insights
The height of each stack within a bin indicates the number of measurements falling into that specific range. The taller the stack, the more measurements it represents. Fascinating, isn’t it?
Predicting the Future
Now, here’s the real power of histograms: they allow us to predict the probability of future measurements. By observing the histogram, we can make an educated guess about where the next measurement will fall within the range. Measurements that lie outside the histogram’s bounds are rarer and less likely to occur in the future.
Justifying Your Decision
If you wish to approximate your data or future measurements using a distribution, histograms can provide valuable insights to support your decision-making process. They offer a tangible representation of the data, enabling you to determine which distribution best fits your needs.
For instance, a normal distribution might be a suitable choice if your data resembles a bell-shaped curve. On the other hand, if your data exhibits a distinct exponential pattern, an exponential distribution might be the better fit.
Optimizing Your Histogram
When creating a histogram, finding the ideal bin width is crucial. If the bins are too narrow, each measurement gets its own bin, which does not offer much insight. Conversely, if the bins are too wide, the measurements are split evenly, revealing only the relative proportions above and below the average.
To overcome this challenge, it’s essential to experiment with different bin widths, as the default settings in most histogram-drawing programs may not provide the clearest picture. Keep tweaking until you find the perfect balance that uncovers the true story hidden within your data.
FAQs
Q: How can I create a histogram?
A: There are numerous software tools available that make creating histograms a breeze. You can use popular data analysis platforms like Python’s Matplotlib, R’s ggplot2, or Excel’s built-in charting functionalities.
Q: Can histograms be used for categorical data?
A: No, histograms are primarily employed for continuous numerical data. For categorical data, other visualization techniques such as bar charts or pie charts are more suitable.
Q: Are there any alternatives to histograms?
A: Yes, box plots and kernel density plots are among the alternatives that can be employed to visualize data distributions. Each technique has its own advantages and can provide unique insights.
Conclusion
Congratulations! You’ve successfully unlocked the secrets of histograms. Now, armed with this knowledge, you can confidently analyze and interpret your data like a pro. Whether you’re a technology enthusiast or a seasoned engineer, histograms are an indispensable tool in your data analysis arsenal. Keep exploring the possibilities, and don’t hesitate to share your newfound wisdom with others!
So, what are you waiting for? Start unleashing the power of histograms today! And remember, for more intriguing tech-related content, stay tuned to Techal!
