Welcome to this informative article on maximum likelihood estimation. In the world of statistics, finding the optimal way to fit a distribution to data is a crucial task. That’s where maximum likelihood estimation comes in. Let’s dive into the details and unravel this fascinating concept.
Contents
What is Maximum Likelihood Estimation?
Maximum likelihood estimation (MLE) is a statistical method used to determine the parameters of a probability distribution that best fits a given set of data. By finding the most likely values for the parameters, MLE enables us to make predictions, draw conclusions, and gain deeper insights from the data.
Fitting a Distribution to the Data
To illustrate the concept of MLE, let’s take an example. Imagine we have measured the weights of a bunch of mice. Our goal is to fit a distribution to these measurements. By doing so, we can simplify the data analysis and apply the findings to similar experiments.
The Normal Distribution
In this case, we suspect that the weights of the mice follow a normal distribution. A normal distribution is characterized by a bell-shaped curve, with most measurements clustering around the mean or average weight. Additionally, we expect the measurements to be relatively symmetrical around this mean.

Finding the Optimal Parameters
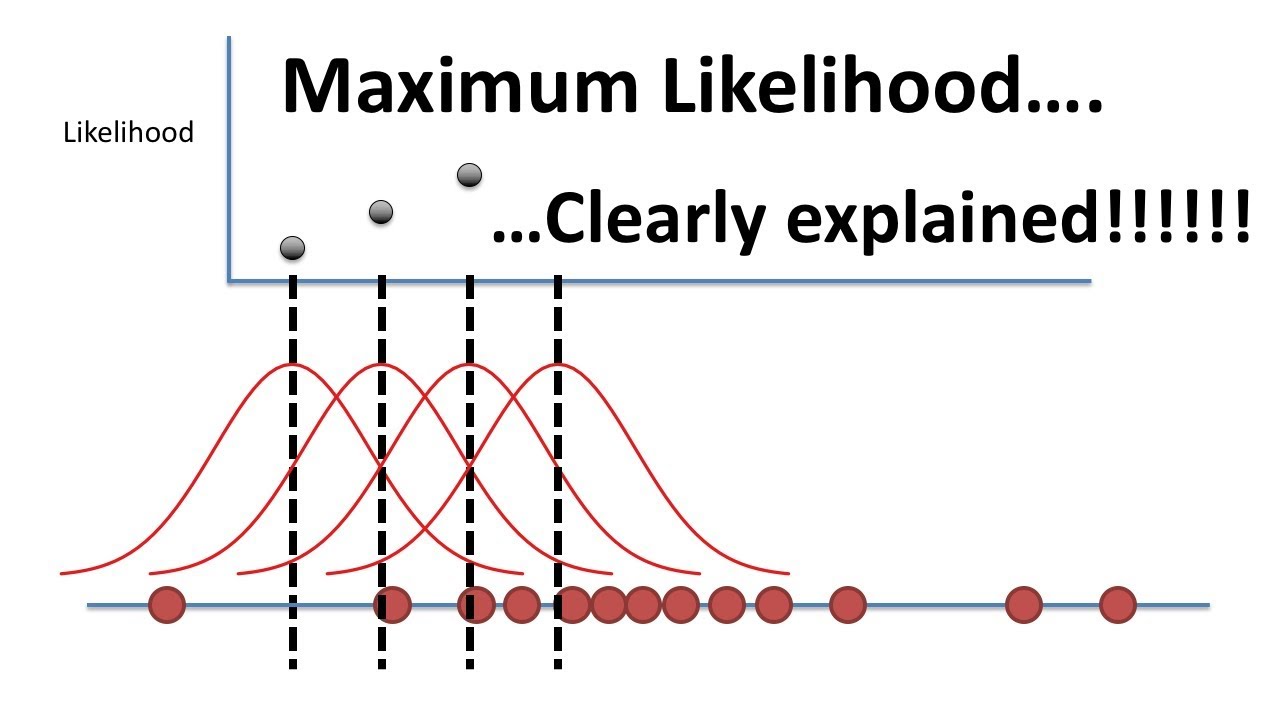
Now, the question is: how do we determine the optimal parameters for our normal distribution? MLE helps us with this task. We start by initially placing the distribution in any arbitrary location. Then, we calculate the likelihood of observing the data based on this starting position.
Next, we shift the distribution slightly and recalculate the likelihood. We repeat this process, moving the distribution one step at a time, until we have tried all possible locations. The location that maximizes the likelihood of observing the measured weights is our maximum likelihood estimate for the mean.
Estimating the Standard Deviation
But the analysis doesn’t stop there. We also need to determine the maximum likelihood estimate for the standard deviation. Similar to finding the mean, we plot the likelihood of observing the data for different values of the standard deviation. The value that maximizes this likelihood becomes our maximum likelihood estimate for the standard deviation.
The Result: A Fitted Distribution
By utilizing the maximum likelihood estimations for the mean and standard deviation, we successfully fit a normal distribution to the measured weights of the mice. This fitted distribution provides valuable insights and simplifies data analysis for future experiments in the same domain.
FAQs
Q: How does maximum likelihood estimation differ from probability?
A: While probability and likelihood are often used interchangeably in everyday conversation, in statistics, likelihood specifically refers to the situation we discussed here. It pertains to finding the optimal values for mean or standard deviation based on a set of observed measurements.
Q: Can maximum likelihood estimation be applied to other types of distributions?
A: Absolutely! Maximum likelihood estimation is a versatile method that can be applied to various distribution types, depending on the nature of the data.
Conclusion
Congratulations! You now have a solid understanding of maximum likelihood estimation and its role in fitting distributions to data. By harnessing the power of MLE, you can uncover valuable insights, make accurate predictions, and enhance your statistical analysis. To delve deeper into the world of technology and empower yourself with knowledge, visit Techal.
