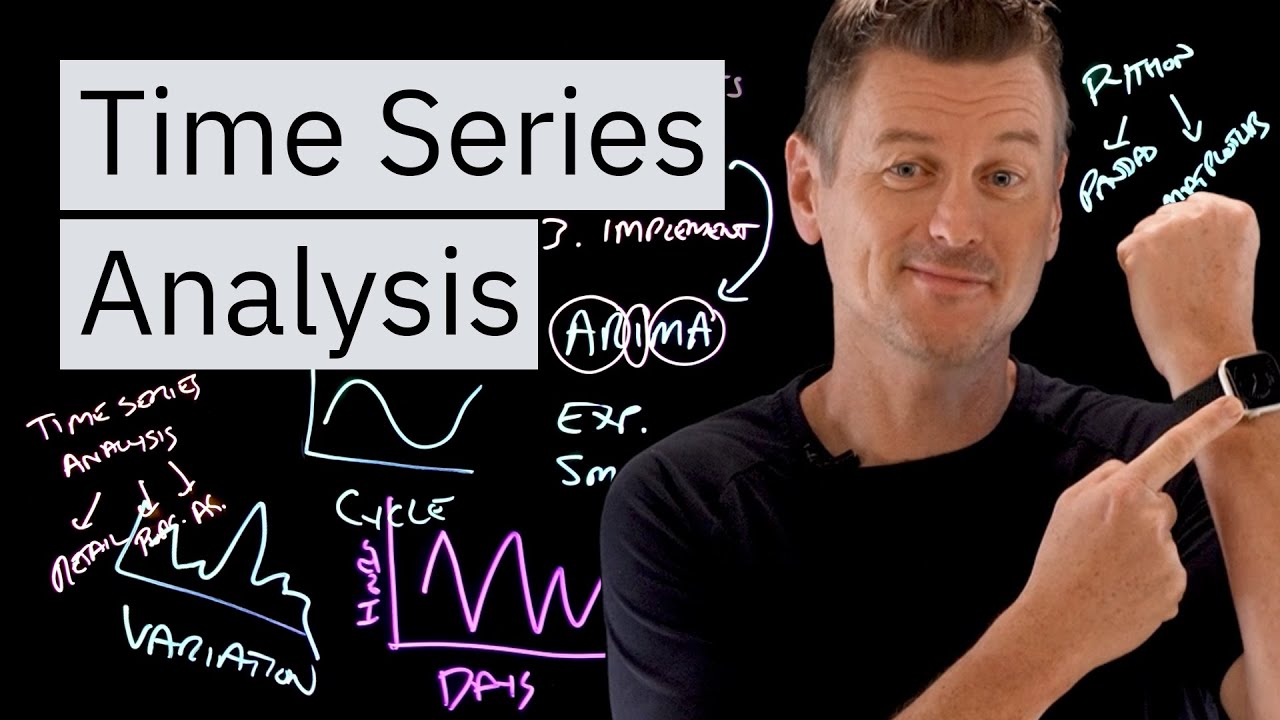
Have you ever wondered how your smartwatch tracks and analyzes your sleep patterns? The answer lies in a powerful technique called time series analysis. By extracting meaningful insights from timestamp data, this method can help predict future trends and drive better business decisions. In this article, we will explore the components of time series analysis, popular forecasting models, and how to implement this technique effectively.
Contents
Components of Time Series Analysis
When we talk about time series analysis, we need to understand its key components. These components provide valuable information about the data being analyzed.
Trend
The trend component of a time series refers to the overall direction of the data over time. It could be increasing, decreasing, or remaining constant. Imagine a line on a graph that either goes up, goes down, or stays flat.
Seasonality
Seasonality represents the repeating pattern of data over a specific period. For example, the spike in retail sales during the holiday season is a seasonal pattern. It recurs regularly, creating a distinct pattern on a graph.
Cycle
While seasonality describes predictable patterns, the cycle component captures non-seasonal repeating patterns. These cycles could span several years or even decades, such as economic booms and busts. The curve representing cycles is generally smoother than the one depicting seasonality.
Variation
Variation, also known as irregularity or noise, refers to the unpredictable ups and downs in the data that cannot be explained by the other components. It adds an element of randomness to the time series and makes identifying trends more challenging.
Forecasting Models for Time Series Analysis
To perform time series analysis effectively, we rely on forecasting models. These models help us make predictions and derive insights from the data.
ARIMA Model
One widely used forecasting model is the Auto Regressive Integrated Moving Average (ARIMA) model. It consists of three components:
-
Auto Regressive (AR): This component analyzes how past values influence future values.
-
Integrated (I): The integrated component accounts for trends and seasonality in the data.
-
Moving Average (MA): The moving average component smooths out noise by removing random movements from the time series.
Exponential Smoothing
Exponential smoothing is another popular forecasting model. It is particularly useful when dealing with time series data that lacks clear trends or seasonality. This model works by assigning more weight to recent values and less weight to older values, effectively smoothing out the data.
While ARIMA and exponential smoothing are just a few examples, several other forecasting models are available. Choosing the right model depends on the specific problem and dataset at hand.
Implementing Time Series Analysis
Now that we understand the components and forecasting models, let’s delve into implementation.
Various software packages can assist in performing time series analysis, such as R, Python, and MATLAB. For Python enthusiasts, two powerful libraries come to the forefront: Pandas and Matplotlib.
-
Pandas: With Pandas, you can effortlessly import, manipulate, and analyze time series data. It handles missing values, aggregates data, and performs statistical analysis.
-
Matplotlib: Matplotlib helps visualize time series data. You can create line charts, scatter plots, and heatmaps to gain insights from the data.
Leveraging these libraries, you can clean and preprocess time series data, conduct exploratory data analysis, and build models. Pandas allows you to preprocess the data, while Matplotlib helps visualize trends and seasonality.
By understanding the components of a time series and selecting the appropriate forecasting model, you can make informed decisions and gain a competitive advantage.
FAQs
Q: Which software packages are best for time series analysis?
A: Several software packages are available for time series analysis, such as R, Python, and MATLAB. In Python, Pandas and Matplotlib are popular libraries for handling and visualizing time series data, respectively.
Q: How can time series analysis benefit businesses?
A: Time series analysis helps businesses predict future trends and make informed decisions. Retailers can forecast sales and optimize inventory levels, purchasers can predict commodity prices, and agriculture professionals can anticipate weather patterns for better harvesting and planting decisions.
Q: Can time series analysis be used for personal purposes, like tracking sleep patterns?
A: Absolutely! Time series analysis is versatile and can be applied to various personal use cases. By analyzing your sleep patterns using a time series approach, you can gain insights into your sleep duration, quality, and identify trends to improve your sleep habits.
Conclusion
Time series analysis empowers businesses and individuals alike to unlock valuable insights. By understanding the components of a time series and employing appropriate forecasting models, you can make data-driven decisions and stay ahead of the curve. Whether you are a data analyst, business owner, or simply curious about your own data, embrace the power of time series analysis and discover what the future holds.
For more informative content on technology and its exciting possibilities, visit Techal.
