Are you ready to dive into the world of multiple regression analysis? In this article, we will explore the ins and outs of this powerful statistical technique using R. Whether you’re a data enthusiast or a tech engineer, this guide will provide you with a solid understanding of multiple regression and how it can be used to predict outcomes based on multiple variables.

Contents
Introduction
Multiple regression analysis is a statistical method used to determine the relationship between a dependent variable and two or more independent variables. It allows us to examine how these independent variables collectively influence the dependent variable. This type of analysis is widely used in various fields, including finance, economics, marketing, and social sciences.
Simple Regression: Predicting Size Based on Weight
Before we delve into multiple regression, let’s start with a simple regression analysis to predict the size of an object based on its weight. Here are the step-by-step instructions:
Step 1: Plotting the Data
The first step in any regression analysis is to plot the data. By visually examining the relationship between the variables, we can determine if a linear regression is appropriate. In our case, we will plot weight on the x-axis and size on the y-axis.

From the plot, we can clearly see a positive relationship between weight and size, indicating that using linear regression is a sensible approach.
Step 2: Fitting a Line to the Data
To fit a line to the data, we will use the lm function in R. This function allows us to specify the equation of the line and estimate the regression coefficients. In our case, the equation will be size ~ weight (size is predicted by weight).
simple.regression <- lm(size ~ weight, data = data_frame)Step 3: Analyzing the Regression Results
Once we have run the regression analysis, we can examine the summary of the results using the summary function. This will provide us with key information, such as the R-squared value and the p-value.
summary(simple.regression)The R-squared value measures the proportion of total variation in the dependent variable (size) that can be explained by the independent variable (weight). In our case, the R-squared value is 0.613, indicating that weight does a good job of predicting size.
Step 4: Visualizing the Regression Line
To visualize the least squares fit line on the graph, we can use the abline function.

Multiple Regression: Predicting Size Based on Weight and Tail
Now that we have covered simple regression, let’s move on to multiple regression. In this example, we will use both weight and tail length as independent variables to predict size. Here’s how to perform a multiple regression analysis:
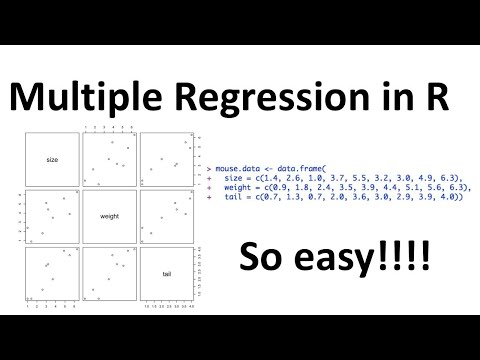
Step 1: Plotting the Data
Just like in simple regression, we start by plotting the data to visualize the relationships between the variables. In this case, R will automatically generate plots for all combinations of variables.

From these plots, we can see that both weight and tail length are correlated with size, indicating they could be reasonable predictors.
Step 2: Fitting a Plane to the Data
To fit a plane to the data, we will use the lm function again. This time, we will specify the equation as size ~ weight + tail (size is predicted by weight and tail).
multiple.regression <- lm(size ~ weight + tail, data = data_frame)Step 3: Analyzing the Regression Results
As before, we can use the summary function to examine the summary of the multiple regression results.
summary(multiple.regression)The adjusted R-squared value, which is more appropriate for multiple regression, indicates the percentage of variance in the dependent variable (size) explained by the independent variables (weight and tail). In our case, the adjusted R-squared value looks promising.
Step 4: Interpreting the Results
Looking at the p-values, we can compare our multiple regression model to two simpler models. The first comparison is between our model (using weight and tail) and a model using only tail to predict size. The p-value suggests that using weight and tail together is not significantly better than using tail alone.
The second comparison is between our model and a model using only weight to predict size. The p-value indicates that using weight and tail together is significantly better than using weight alone.
In conclusion, using weight and tail as predictors for size is a good choice. However, if we want to save time and resources, we could solely rely on tail length to predict size.
FAQs
1. What is multiple regression analysis?
Multiple regression analysis is a statistical method used to examine the relationship between a dependent variable and two or more independent variables. It allows us to predict outcomes based on multiple variables and understand how these variables collectively influence the outcome.
2. When should I use multiple regression analysis?
Multiple regression analysis is commonly used when you have multiple independent variables and want to predict the value of a dependent variable. It is useful for understanding the relative importance of each independent variable and how they interact to influence the dependent variable.
3. How do I interpret the R-squared value in multiple regression?
The R-squared value in multiple regression represents the proportion of variance in the dependent variable that can be explained by the independent variables. It ranges from 0 to 1, with higher values indicating a stronger relationship between the variables.
Conclusion
In this article, we explored the step-by-step process of performing multiple regression analysis using R. We started with a simple regression analysis and then moved on to multiple regression, considering both weight and tail length as predictors for size. By understanding the results and interpreting the statistics, we gained valuable insights into the relationships between the variables. Whether you’re a data enthusiast or a tech engineer, mastering multiple regression analysis can greatly enhance your analytical skills.
To learn more about tech-related topics and stay updated with the latest trends, visit Techal. Keep questing and exploring the exciting world of technology!