Regression trees are a powerful tool for making accurate predictions in complex scenarios. In this article, we will delve into the concept of regression trees and how they can be utilized effectively.

Contents
Introduction: Unveiling the Potential of Regression Trees
Regression trees are a type of decision tree algorithm that enable us to make numeric predictions. Unlike classification trees, which assign discrete categories, regression trees provide us with continuous values as predictions. By understanding and implementing regression trees, we can optimize our predictions and make more informed decisions in various fields, such as healthcare, finance, and technology.
Before we proceed, it is crucial to have a solid grasp of the bias-variance tradeoff, decision trees, and the fundamentals of regression analysis. If you need a refresher, feel free to check out the related resources provided in the description below.
How Regression Trees Work: A Step-by-Step Explanation
To illustrate the essence of regression trees, let’s consider a scenario where we aim to determine the effectiveness of a new drug for the common cold. In a clinical trial, we collect data on different dosages and measure their respective effectiveness.
The Data: Making Sense of Dosages and Effectiveness
The data reveals a trend: the higher the dosage, the more effective the drug. However, there are instances where the relationship between dosage and effectiveness is not linear. For example, low dosages may be ineffective, moderate dosages work well, slightly higher dosages offer moderate effectiveness, and high dosages are again ineffective.
To accurately predict the effectiveness of the drug for given dosages, we cannot rely on a simple straight line. This is where regression trees come into play.
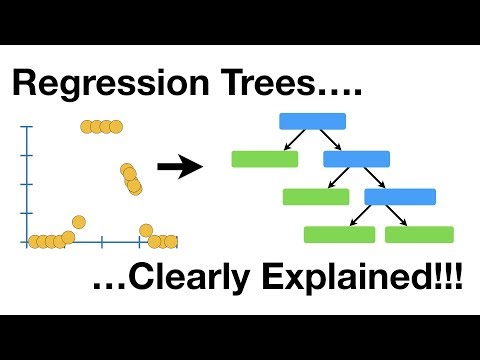
Building a Regression Tree: Dividing Data into Clusters
Regression trees divide the data into clusters based on different dosage ranges. Each cluster represents a group of observations with similar characteristics and effectiveness. By assigning an average value to each cluster, the tree can generate precise predictions.
Let’s visualize this process with a regression tree:

In this example, the root of the tree represents a threshold dosage of 14.5. If the dosage is less than 14.5, the average effectiveness of 4.2% is assigned. If the dosage falls between 14.5 and 29, the tree further splits the data into two branches. The left branch represents dosages between 14.5 and 23.5, with an average effectiveness of 100%. The right branch includes dosages between 23.5 and 29, with an average effectiveness of 52.8%.
By using this regression tree, we can make precise predictions for various dosages, even in cases where the relationship between dosage and effectiveness is not straightforward.
Advantages of Regression Trees: Handling Complex Data
You might wonder why we would use a regression tree when simple visual analysis suffices for predicting drug effectiveness with just one predictor (dosage). The answer lies in the ability of regression trees to handle complex, multidimensional data.
Imagine we want to predict drug effectiveness using multiple predictors, such as dosage, age, and sex. Drawing visual graphs would become increasingly challenging, if not impossible. In contrast, regression trees readily accommodate these additional predictors and provide accurate predictions.
For instance, let’s consider a patient who is younger than 50, takes a dosage greater than or equal to 29, and is female. Following the respective branches of the regression tree, we predict that the drug will be 100% effective. Indeed, the actual effectiveness is 98%, illustrating the tree’s accuracy and usefulness in complex scenarios.
FAQs
Q1: Can a regression tree be overfit?
A1: Yes, a regression tree can be overfit when it perfectly fits the training data. However, an overfit model is likely to perform poorly with new data. To prevent overfitting, one strategy is to introduce a minimum number of observations required for each split (e.g., 20). This limits the tree’s growth and helps strike a balance between bias and variance.
Q2: Are there techniques to evaluate regression tree predictions?
A2: Yes, the sum of squared residuals (SSR) is a commonly used metric to evaluate regression tree predictions. By calculating the difference between observed and predicted values, squaring the difference, and summing up the squared residuals for all data points, we can quantify the quality of the predictions. Lower SSR values indicate better predictions.
Q3: How can one handle regression problems with multiple predictors?
A3: When dealing with multiple predictors, we follow a similar process as with a single predictor. We assess different thresholds for each predictor, calculate the sum of squared residuals at each step, and select the threshold that minimizes the SSR. The predictor with the lowest SSR becomes the root of the tree, and we continue splitting the data until further divisions offer minimal improvement.
Conclusion
Regression trees offer a powerful framework for predicting numeric values in complex scenarios. By dividing data into clusters based on different thresholds, regression trees enable accurate predictions for various predictors. With the ability to handle multiple predictors, regression trees provide invaluable insights in numerous domains. Embracing regression trees empowers decision-makers to navigate the intricacies of data and make well-informed choices.
To learn more about the fascinating world of technology and stay updated on the latest trends, visit Techal.
Remember, in the realm of technology, knowledge is power, and Techal is here to guide you every step of the way. Happy questing!