Have you ever wondered how computers can understand images? How can they tell whether a picture is of a cat or a dog? Well, the answer lies in dimensionality reduction techniques like Eigenpets. In Part 2 of this series, we will delve deeper into the world of Eigenpets and explore how they help us make sense of complex data sets.
Contents
The Power of Eigenpets
In the previous article, we separated the cat and dog images and computed their mean values. Now, we are going to put the two data sets back together and perform Principal Component Analysis (PCA) on them. PCA allows us to identify the most significant components of a data set by decomposing the covariance matrix.
But wait! Computing the covariance matrix can be computationally expensive. Luckily, there is a numerical technique known as Singular Value Decomposition (SVD) that allows us to compute the principal components efficiently. In SVD, we decompose the data matrix X into the product of three matrices: U, Sigma, and V. The matrix V, in SVD, is the same as the matrix W we obtained from the Eigen decomposition of X transpose X. In this article, we will be using SVD to perform PCA.
Exploring the Data Set
Let’s dive into the practical application of PCA. We’ll begin by loading up our data set containing images of cats and dogs. We will then compute the SVD of the data matrix X. By examining the singular values, we can gain insight into the complexity and variability of the data set.
Plotting the cumulative sum of the singular values, we observe that a large number of singular values are required to explain a substantial portion of the data’s variance. This indicates that our data set is noisy and variable, as expected from real-life pet images. Although these singular values do not fully capture all the variability, they provide us with a valuable understanding of the data’s characteristics.
Visualizing the Principal Components
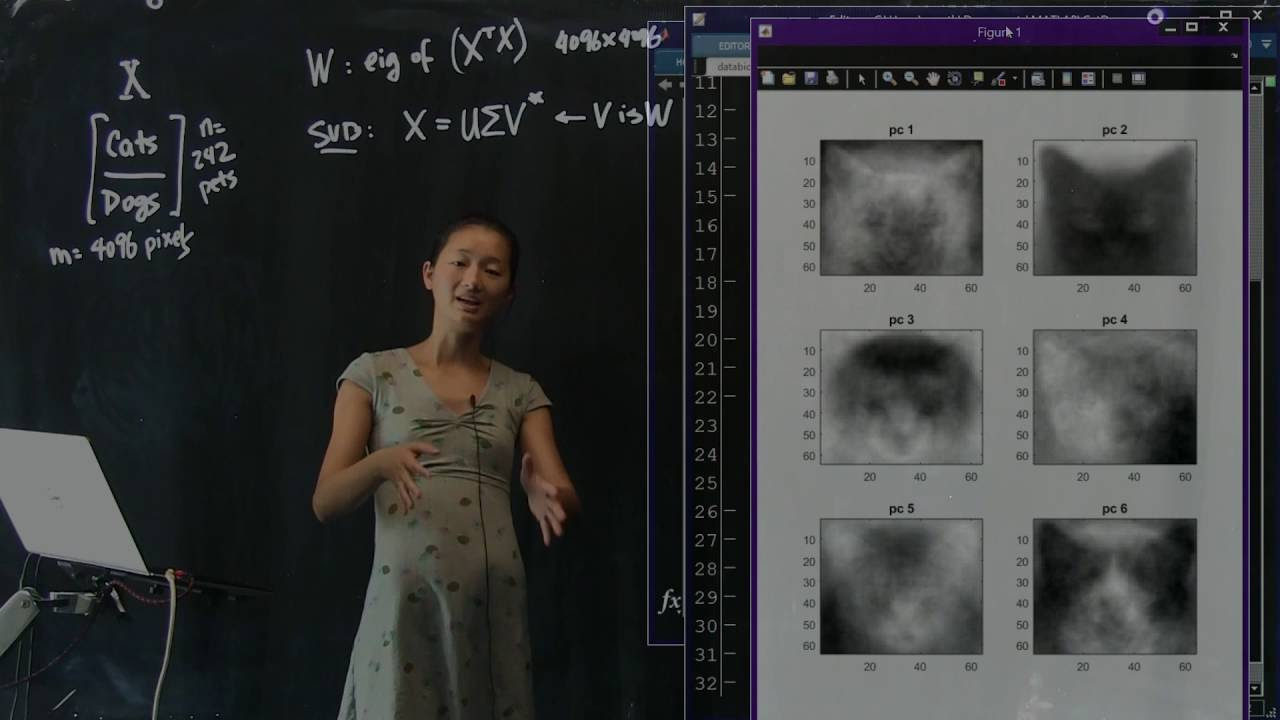
Next, let’s explore the principal components. The first principal component, pc1, is simply the first column of the matrix V. This component represents the direction that accounts for the most variance in the data.
To grasp the concept of pc1, let’s reshape it as an image. By visualizing pc1, which we call “Eigenpet 1,” we can observe a fuzzy representation that highlights the common features shared by all the pet images, such as aligned eye positions and cropped heads.
We can also examine the next principal components, such as pc2 and pc3. These components reveal additional patterns and variations within the data set. It’s fascinating to see how pc2 resembles a cat and pc3 captures a mixed representation of both cats and dogs.
Projecting the Data
Now, let’s project the data points onto pc1 and pc2. By measuring the similarity between each image and these components, we obtain a numerical value that characterizes the degree of resemblance. Plotting these values as a scatter plot, we can visualize a cloud of data points with each point representing an image’s similarity to pc1 and pc2.
Surprisingly, when we color the points based on whether the image is of a cat or a dog, we find that the two categories largely overlap. This suggests that the separation between cats and dogs is not well-defined solely based on pc1 and pc2. However, we should not be discouraged, as there might be dimensions beyond pc1 and pc2 that better capture the differences between cats and dogs.
Exploring Higher Dimensions
To uncover possible patterns and separations between cats and dogs, we project the data onto pc3, pc4, and pc5. By visualizing these three principal components in a three-dimensional scatter plot, we can observe a clearer distinction between the two classes. The centroid of the red dots (cats) appears lower in pc3, indicating a slight separation from the centroid of the blue dots (dogs).
It’s important to note that while pc1 and pc2 explain a significant portion of the variance, they may not be the best dimensions for classifying cats and dogs. By increasing the number of principal components and projecting the data accordingly, we can potentially achieve better separation and classification.
Conclusion
Eigenpets, a dimensionality reduction technique based on PCA and SVD, offer valuable insights into complex data sets like pet images. By exploring the principal components, projecting the data, and visualizing the results, we can gain a deeper understanding of the similarities and differences between cats and dogs.
While our initial attempts to separate cats and dogs using pc1 and pc2 were not entirely successful, increased dimensionality and further analyses hold the promise of better separation. In subsequent articles, we will explore techniques to build classifiers on top of dimensionally reduced data in pursuit of accurate cat-dog classification and facial recognition.
For more insights and exploration into the world of technology, visit Techal.
FAQs
Q: How does Eigenpets work?
A: Eigenpets uses Principal Component Analysis (PCA) and Singular Value Decomposition (SVD) to reduce the dimensionality of complex data sets. By decomposing the data matrix and identifying the most significant components, Eigenpets allow us to gain insights into the underlying patterns and variations.
Q: Can Eigenpets perfectly separate cats and dogs?
A: While Eigenpets provide valuable visualizations and insights, achieving a perfect separation between cats and dogs solely based on principal components can be challenging. However, by increasing the number of dimensions and employing advanced classification techniques, we can achieve better separation and classification accuracy.
Q: How can Eigenpets be applied to other data sets?
A: Eigenpets can be applied to various data sets beyond pet images. By performing PCA and SVD on different types of data, we can uncover meaningful patterns and reduce the dimensionality while preserving the most important characteristics. The application of Eigenpets is limited only by the nature of the data and the problem at hand.
Q: What are the potential applications of Eigenpets?
A: The applications of Eigenpets extend beyond pet image analysis. Eigenpets can be utilized in facial recognition, data compression, outlier detection, and more. By reducing the dimensionality and capturing the most significant features, Eigenpets enable us to gain insights and make informed decisions in a wide range of applications.
Conclusion
Eigenpets, with their ability to reduce dimensionality and provide visual insights, offer a powerful tool for analyzing complex data sets. By exploring the principal components, projecting the data, and visualizing the results, we gain a deeper understanding of the underlying patterns and variations. Despite the challenges in separating cats and dogs solely based on principal components, the potential for improved classification and accurate facial recognition is within reach. Stay tuned for more articles on how we can build upon dimensionality reduction techniques to further advance technology applications.
