Logistic regression is an important statistical tool used to analyze relationships between variables, particularly in predicting outcomes. In this guide, we will dive deep into the details of logistic regression, specifically focusing on the coefficients that are the results of this analysis. Understanding these coefficients is crucial for interpreting and making predictions based on logistic regression models. Let’s explore!
Contents
Logistic Regression Basics
Before we delve into the details of logistic regression coefficients, let’s briefly review the basics of logistic regression. Logistic regression is a specific type of generalized linear model (GLM) that extends the concepts and abilities of regular linear models. If you are familiar with linear models, you are well on your way to understanding logistic regression.
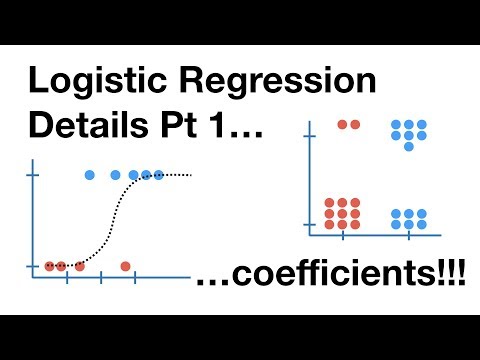
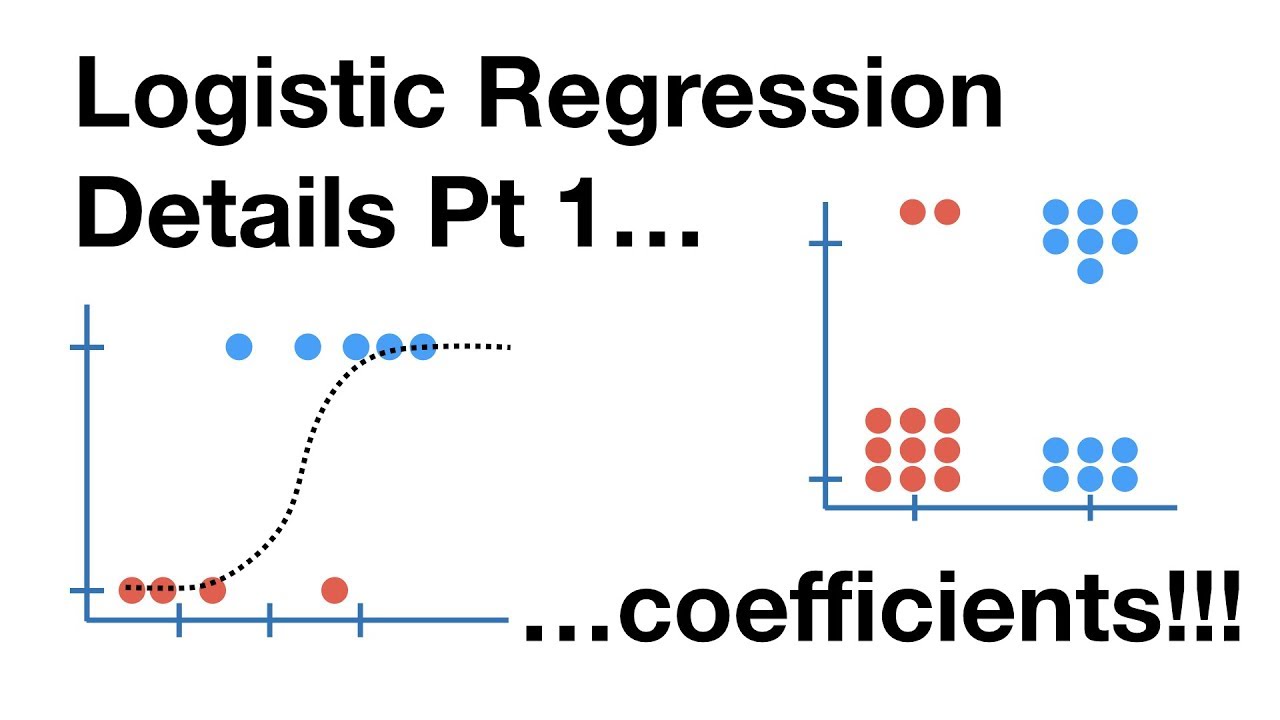
In logistic regression, we use predictor variables to determine the probability of an outcome. For example, we might use the weight of a mouse to predict whether it is obese or not. The probability of a mouse being obese is represented on the y-axis, ranging from 0 (not obese) to 1 (obese). Logistic regression fits a line to the data to predict the probability of obesity based on the weight of the mouse.
Coefficients in Logistic Regression
Now, let’s focus on the coefficients in logistic regression models. Like linear regression, logistic regression models have coefficients for the intercept and slope of the line. The intercept represents the log odds of the outcome when all predictor variables are zero, while the slope represents the change in log odds for each unit change in the predictor variable.
However, unlike linear regression, logistic regression is confined to probability values between 0 and 1. To solve this problem, the y-axis in logistic regression is transformed from the probability of obesity to the log odds of obesity. This transformation allows logistic regression to use a line that extends from negative infinity to positive infinity on the y-axis.
Interpreting Coefficients
To interpret the coefficients in logistic regression, we examine their values, standard errors, and Z-values. The intercept coefficient represents the log odds of obesity when the predictor variable is zero. A coefficient close to zero indicates that the predictor variable has little effect on the log odds of obesity.
The slope coefficient indicates the change in log odds of obesity for each unit change in the predictor variable. A positive coefficient suggests an increase in the log odds of obesity, while a negative coefficient suggests a decrease. The standard error measures the uncertainty in the estimated coefficient, while the Z-value indicates the number of standard deviations the coefficient is away from zero.
Logistic Regression with Discrete Variables
Logistic regression can also be used to test the relationship between a discrete variable and an outcome, such as testing if a mutated gene is related to obesity in mice. In this case, we fit two lines to the data: one for mice with a normal gene and one for mice with a mutated gene. The coefficients for these lines represent the log odds of obesity for each group.
By comparing the coefficients for the two groups, we can determine how the presence of a mutated gene affects the odds of obesity. Positive coefficients indicate an increase in the odds, while negative coefficients indicate a decrease. As with continuous variables, the standard error and Z-value help determine the significance of the coefficients.
Conclusion
Logistic regression is a powerful tool for analyzing relationships between variables and making predictions about outcomes. Understanding the coefficients in logistic regression models is essential for interpreting the results and making informed decisions. Whether you’re working with continuous or discrete variables, the coefficients provide valuable insights into the log odds of the outcome. So, next time you encounter a logistic regression analysis, you’ll be well-equipped to decipher the coefficients and unlock their meaning.
FAQs
Q: Can logistic regression be used for continuous variables?
A: Yes, logistic regression can be used with continuous variables. In such cases, the coefficients represent the change in log odds for each unit change in the predictor variable.
Q: How do I determine the significance of logistic regression coefficients?
A: The significance of logistic regression coefficients can be determined by examining the standard error and Z-value. If the Z-value is greater than two or less than negative two, the coefficient is considered statistically significant.
Q: Can logistic regression be used for multivariable analysis?
A: Yes, logistic regression can be extended to include multiple predictor variables, allowing for more comprehensive analysis and prediction.
Q: Where can I learn more about logistic regression and its applications?
A: To dive deeper into the world of logistic regression and its applications, you can check out the comprehensive resources available at Techal.
Remember, the world of logistic regression is vast and full of possibilities. By understanding the coefficients, you gain valuable insights into the relationships between variables and can make informed decisions based on your analyses. So, keep exploring and quest on!