Welcome back, technology enthusiasts! In today’s article, we will delve into the world of classifier metrics. These metrics play a crucial role in evaluating the performance of classification models and allow us to gauge the accuracy and effectiveness of our systems.
Contents
Confusion Matrices: The Building Blocks
Before we deep dive into classifier metrics, let’s start by understanding confusion matrices. Confusion matrices are fundamental data structures that help us perform various calculations and analysis related to our classification models.

A confusion matrix showcases the actual labels across the rows and the predictions made by a classifier model across the columns. Each cell in the matrix represents the number of instances falling into a specific category.
Accuracy: The Familiar Metric
Accuracy is arguably the most well-known and widely used classifier metric. It measures the number of correct predictions made by a model divided by the total number of examples.

While accuracy provides a holistic measure of how often a system is correct, it does have its limitations. It does not account for per-class accuracy and fails to control for class size imbalances. For example, if a classifier performs well on a large class but poorly on smaller classes, accuracy may not accurately represent overall performance.
Precision, Recall, and F-Score: Balancing Act
To address the limitations of accuracy, we turn to precision, recall, and F-scores. Precision measures the percentage of correct positive predictions made by the classifier.

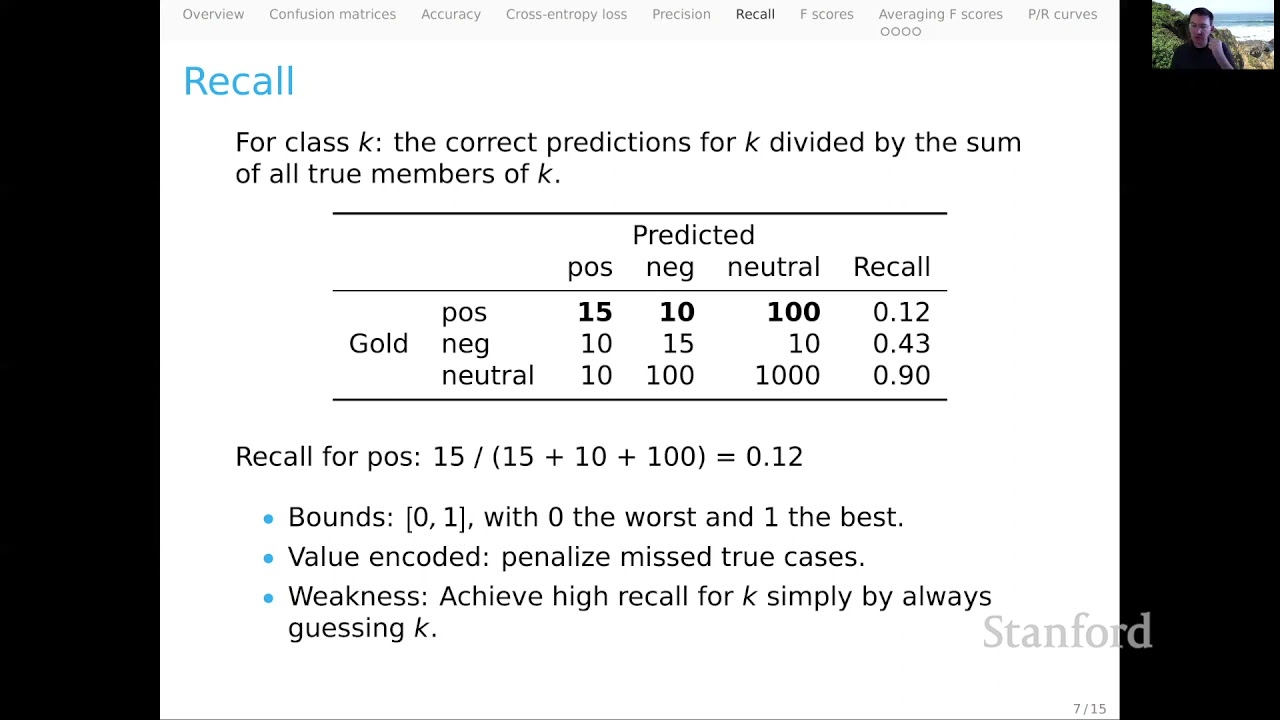
Recall, on the other hand, evaluates the percentage of true positive instances correctly identified by the classifier.

F-scores are a harmonic mean of precision and recall, offering a balanced perspective.

While F-scores provide valuable insights, they also have their own weaknesses. They do not normalize for dataset size, and for a given class, they ignore data outside the relevant confusion matrix cells. Hence, they may not accurately reflect model performance in situations when small classes carry significant importance.
Averaging Strategies: Finding the Right Balance
To assess model performance comprehensively, we can average F-scores in different ways:
-
Macro-Averaging: This approach calculates the arithmetic mean of F-scores for each class, treating all classes equally regardless of size. While it provides a summary metric, it may overlook the impact of imbalanced class sizes.
-
Weighted Averaging: Weighted averaging takes into account the support, or the number of instances, for each class. This approach offers a more nuanced evaluation by considering class sizes, but large classes can dominate the results.
-
Micro-Averaging: Micro-averaging treats the entire dataset as a whole, calculating F-scores by merging the confusion matrices of individual classes. However, this approach can lead to a lack of a single summary number and brings us back to accuracy with a more complex calculation.
Ultimately, the choice of averaging strategy depends on your specific goals, values, and hypotheses. It’s essential to align the method with your desired balance between precision and recall.
Precision-Recall Curves: Exploring the Trade-Off
Precision and recall curves provide an alternative perspective, allowing us to explore the trade-off between precision and recall at different thresholds. By plotting precision against recall, we can identify the optimal balance based on our problem and goals.

Conclusion
Classifier metrics are powerful tools to assess the performance of classification models. From accuracy to precision, recall, and F-scores, each metric offers unique insights into system accuracy and effectiveness. Averaging strategies and precision-recall curves provide additional perspectives and help us evaluate performance comprehensively.
Remember, the choice of metrics and averaging strategies should be aligned with your goals and values for the specific task at hand. By leveraging these classifier metrics effectively, you can make informed decisions and optimize your technology solutions.
Stay tuned for more insightful articles on the ever-evolving world of technology!
FAQs
Q: What are classifier metrics?
A: Classifier metrics are evaluation metrics used to assess the performance of classification models. They measure the accuracy, precision, recall, and F-scores of the models, providing insights into their effectiveness.
Q: What is the difference between accuracy and precision?
A: Accuracy measures the overall correctness of a classification model’s predictions, while precision focuses on the model’s ability to correctly predict positive instances.
Q: How can I choose the right averaging strategy for my model?
A: The choice of averaging strategy depends on your specific goals, values, and hypotheses. Macro-averaging treats all classes equally, while weighted averaging takes class size into account. Micro-averaging treats the dataset as a whole. Consider the importance of class sizes and the overall picture you want to convey when making your choice.
Q: How do precision-recall curves help in evaluating model performance?
A: Precision-recall curves plot the trade-off between precision and recall at different thresholds. They allow you to identify the optimal balance based on your specific problem and goals.
For more information and resources on technology, visit Techal.
