The world of data analysis revolves around finding relationships and patterns in data. One such measure that helps us understand these relationships is called correlation. In this article, we will explore Pearson’s correlation, a widely used method to quantify the strength of relationships between variables.
Contents
Introduction
Have you ever wondered how two sets of data are related to each other? Pearson’s correlation can help us answer this question. Whether you’re analyzing gene expression data or comparing the number of green and red apples in different grocery stores, understanding correlation can provide valuable insights.

Understanding Relationships between Variables
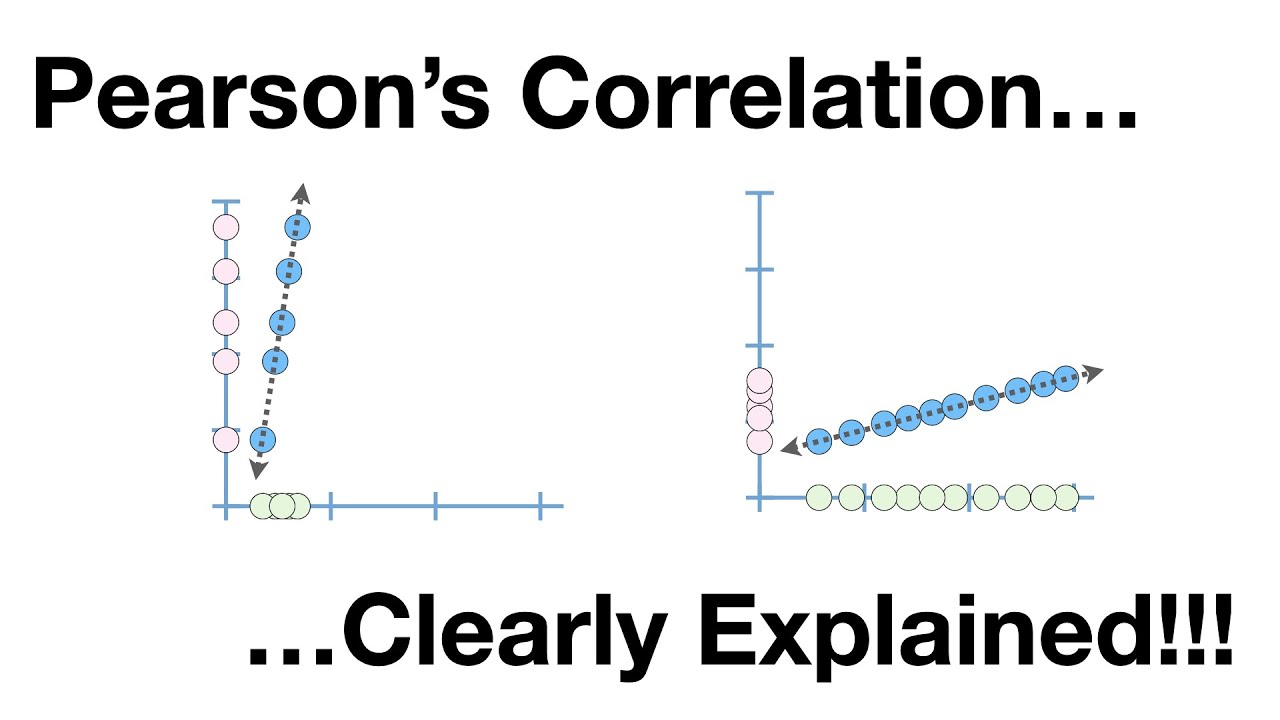
To start, let’s focus on understanding relationships between variables. Imagine we have data points for gene X and gene Y. By plotting these data points on a graph, we can observe a pattern. When gene X has relatively low values, gene Y also tends to have low values. Conversely, higher values of gene X are paired with higher values of gene Y. We can represent this pattern with a straight line, indicating a positive correlation between gene X and gene Y.
Quantifying the Strength of Relationships
Correlation is a numerical measure that quantifies the strength of relationships between variables. It ranges from -1 to 1. A correlation of 1 indicates a strong positive relationship, while a correlation of -1 indicates a strong negative relationship. A correlation of 0 suggests no relationship between the variables.
Interpreting Correlation Values
Let’s break down the interpretation of correlation values:
- A correlation of 1 or -1 implies a perfect linear relationship between the variables. This means that if we know the value of gene X, we can accurately predict the value of gene Y.
- As the correlation value gets closer to 0, the relationship becomes weaker. In this scenario, gene X provides less information about gene Y, and predictions become less accurate.
Confidence in Correlation
The more data we have, the more confident we can be in our predictions based on correlation. A larger sample size increases our confidence since it reduces the likelihood of random chance affecting the relationship we observe.
Calculating Correlation
To calculate correlation, we use the covariance of gene X and gene Y divided by the square root of the variances of gene X and gene Y. This normalization ensures that the scale of the data does not affect the correlation value.
Importance of P-Value
To gauge our confidence in the relationship, we use a p-value. A smaller p-value indicates a stronger relationship, as it represents the probability of randomly obtaining a similar or stronger relationship. The smaller the p-value, the more confidence we can have in our predictions.
Conclusion
Understanding Pearson’s correlation is crucial for uncovering relationships between variables in your data. By quantifying the strength of these relationships, you can make informed predictions and draw meaningful insights. Remember, the higher the correlation value, the stronger the relationship, and the more confidence you can have in your predictions.
For more informative content on a wide range of technology topics, visit Techal.
FAQs
Q: What is Pearson’s correlation?
A: Pearson’s correlation is a statistical measure used to quantify the strength of the linear relationship between two variables.
Q: How is correlation calculated?
A: Correlation is calculated by dividing the covariance of the variables by the product of their standard deviations.
Q: Does correlation imply causation?
A: No, correlation does not imply causation. A strong correlation between two variables does not necessarily mean that one variable causes changes in the other.
Q: How does sample size affect correlation?
A: Larger sample sizes increase confidence in the correlation value as they reduce the likelihood of random chance affecting the relationship observed.
Q: What is the significance of the p-value in correlation analysis?
A: The p-value indicates the probability of obtaining a similar or stronger relationship by chance alone. A smaller p-value suggests a stronger relationship.
Conclusion
Understanding correlation is crucial in data analysis as it helps us uncover and quantify relationships between variables. By analyzing correlation values and considering sample sizes, we can make more robust predictions and draw meaningful insights from data.
For more insightful articles and comprehensive guides on technology, visit Techal.
