Welcome to another exhilarating StatQuest! In this article, we will delve into the intriguing world of maximum likelihood estimation (MLE) for the normal distribution. Fear not, as we will guide you through the entire process, step by step, to demystify this statistical concept.
Contents
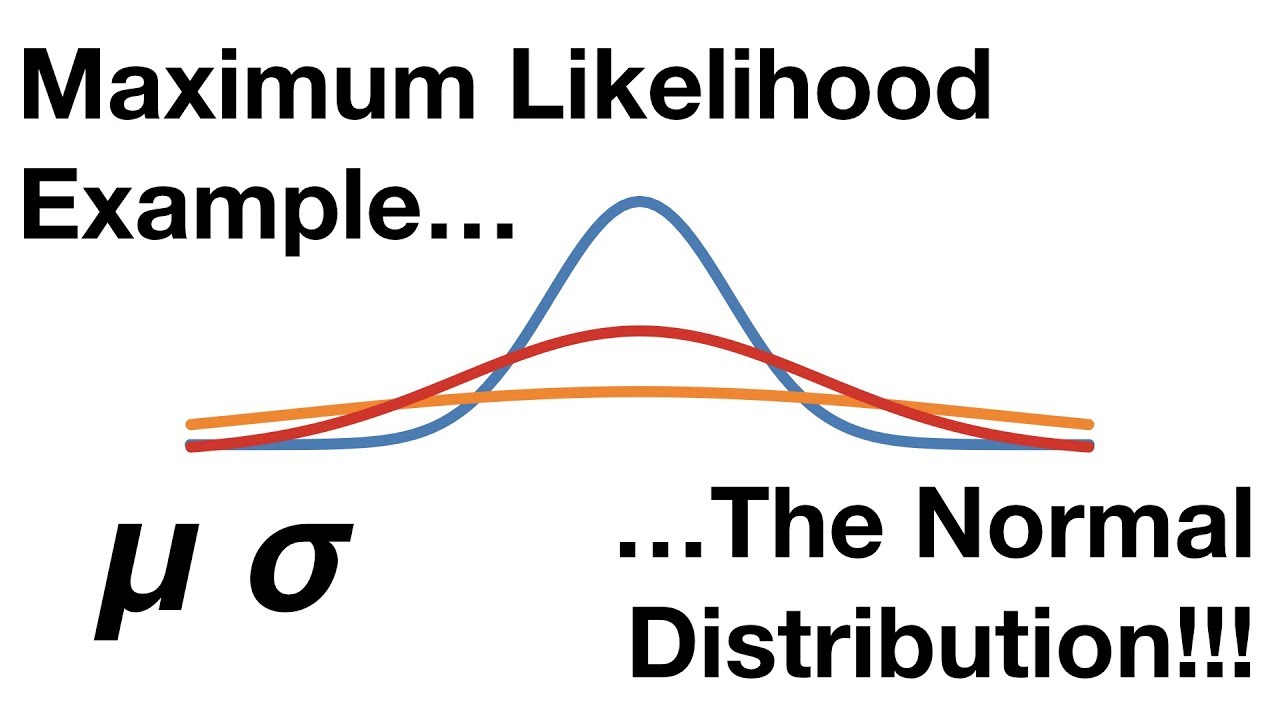
The Basics: Understanding the Normal Distribution
Before we embark on our MLE journey, let’s quickly recap the basics of the normal distribution. The normal curve is characterized by two parameters: μ (mu), which represents the mean and determines the center of the distribution, and σ (sigma), which denotes the standard deviation and influences the spread of the curve.
The Likelihood Function: Seeking the Optimal Parameters
Now, let’s move on to MLE, where we utilize the likelihood of the normal distribution to determine the optimal values for μ and σ, given a set of data points (x). To demonstrate this, we will start with the simplest scenario: a single measurement.
Consider the weight of a mouse, which we measure as 32 grams. By overlaying a normal distribution with μ equals 28 and σ equals 2 onto this data point, we can calculate the likelihood of the data given this curve. We plug the values into the likelihood function and perform the necessary calculations.

Now, suppose we shift the distribution slightly to the right by setting μ equals 30. We repeat the process and calculate the likelihood once again.
To find the maximum likelihood estimate for μ, we can fix σ (since it is a given) and plug in various values for μ. By calculating the likelihood for each value and plotting the results on a graph, we can identify the peak, which corresponds to the optimal μ value.
Similarly, we can fix μ (treated as a given) and determine the optimal σ value by calculating the likelihood for different σ values. Please note that multiple measurements are necessary to find the optimal value for σ.
Multiple Measurements: Taking it to the Next Level
Moving on to a more complex scenario, let’s examine a two-sample data set. Imagine we have weighed two mice, with the first mouse (X sub 1) weighing 32 grams and the second mouse (X sub 2) weighing 34 grams.
By applying the same principles, we can calculate the likelihood for each individual data point independently and then combine them. Since the measurements are independent, the likelihood of the normal distribution with μ equals 28 and σ equals 2, given both X sub 1 and X sub 2, is equal to the product of the likelihoods for X sub 1 and X sub 2. Plugging in the values and performing the calculations, we obtain the overall likelihood.
Suppose we have a third data point, X sub 3. We can simply add it to the given side of the overall likelihood and include an additional individual likelihood term in our multiplication. This process extends naturally to cases with an arbitrary number of data points: we add all n data points to the given side of the overall likelihood function and multiply together the individual likelihood functions.
Determining the Maximum Likelihood Estimates
Now, let’s focus on finding the maximum likelihood estimates (MLE) for μ and σ. Brace yourself, as there will be some math involved, but we will break it down step by step.
To find the MLE for μ, we treat σ as a constant and solve for where the derivative of the log-likelihood function with respect to μ equals zero. This corresponds to the point where the slope of the curve is zero, indicating the peak.
To find the MLE for σ, we treat μ as a constant and solve for where the derivative of the log-likelihood function with respect to σ equals zero. Again, this represents the point where the slope is zero, indicating the peak.
By following these procedures and performing the necessary calculations, we can determine the MLE for μ and σ.
Conclusion
Congratulations on completing this exciting journey through maximum likelihood estimation for the normal distribution! We have unraveled the steps involved in finding the optimal parameters for the normal curve, namely μ and σ. Remember, the MLE for μ corresponds to the mean of the data, while the MLE for σ corresponds to the standard deviation.
To continue exploring captivating StatQuests and stay up to date with our latest content, please consider subscribing. And if you wish to support StatQuest, you can explore and purchase some of our original songs. Until next time, keep questing!
FAQs
Q: What is maximum likelihood estimation (MLE)?
A: Maximum likelihood estimation is a statistical method used to determine the values of unknown parameters in a model by maximizing the likelihood function. In the case of the normal distribution, MLE helps us find the optimal values for μ and σ that best fit our data.
Q: How do you calculate the likelihood of a normal distribution?
A: The likelihood of a normal distribution is calculated by plugging in the values of the data points into the likelihood function. This function represents the probability of observing the given data under the assumption of a particular normal distribution.
Q: Why do we take the logarithm of the likelihood function?
A: Taking the logarithm of the likelihood function simplifies the calculations and makes it easier to find the maximum likelihood estimates. The logarithm also ensures that the product of the likelihoods becomes the sum of the log-likelihoods, which simplifies further analysis.
Q: What is the significance of finding the maximum likelihood estimates for μ and σ?
A: By finding the maximum likelihood estimates for μ and σ, we obtain the most likely values that accurately represent the center and spread of the normal distribution given our data. These estimates provide crucial insights and help us make informed decisions in various practical applications.
Conclusion
In this article, we explored the fascinating world of maximum likelihood estimation for the normal distribution. We learned how to calculate the likelihood of the data given a normal curve, determine the maximum likelihood estimates for μ and σ, and the significance of these estimates. Armed with this knowledge, you are now equipped to embark on your own statistical adventures. Keep exploring, keep learning, and keep pushing the boundaries of what technology can achieve.
