Welcome back, everyone! In this section, we will dive into the fascinating world of principal components analysis (PCA) and the singular value decomposition (SVD). To make things more exciting, we will explore a large, high-dimensional dataset consisting of images. Visual learning is powerful, and these images will help us grasp the concepts intuitively.
So, let’s begin with the dataset we’ll be working on – an intriguing collection of pet images, featuring both cats and dogs. Images make excellent teaching aids, as our visual cortex is designed to process and understand visual information quickly. By exploring this dataset, we’ll not only gain insights into image analysis but also develop a strong foundation for understanding other complex datasets.
The Dataset: Cats and Dogs Galore
Allow me to introduce you to the “Cat Dog” dataset – a treasure trove of pet images that we’ll soon uncover. Let’s load up this dataset, which is stored as a large data matrix called X. In this case, our dataset consists of 242 samples, each representing an image of a pet. These images are made up of 4,096 pixels, which we consider as our measurements.
By treating each pixel as an individual measurement, we expand this dataset into a staggering 4,096-dimensional entity. Yes, you heard it right! This dataset truly exemplifies the high dimensionality of image datasets. Although the images may appear pixelated compared to smartphone pictures, analyzing them will help us appreciate the complexities involved.
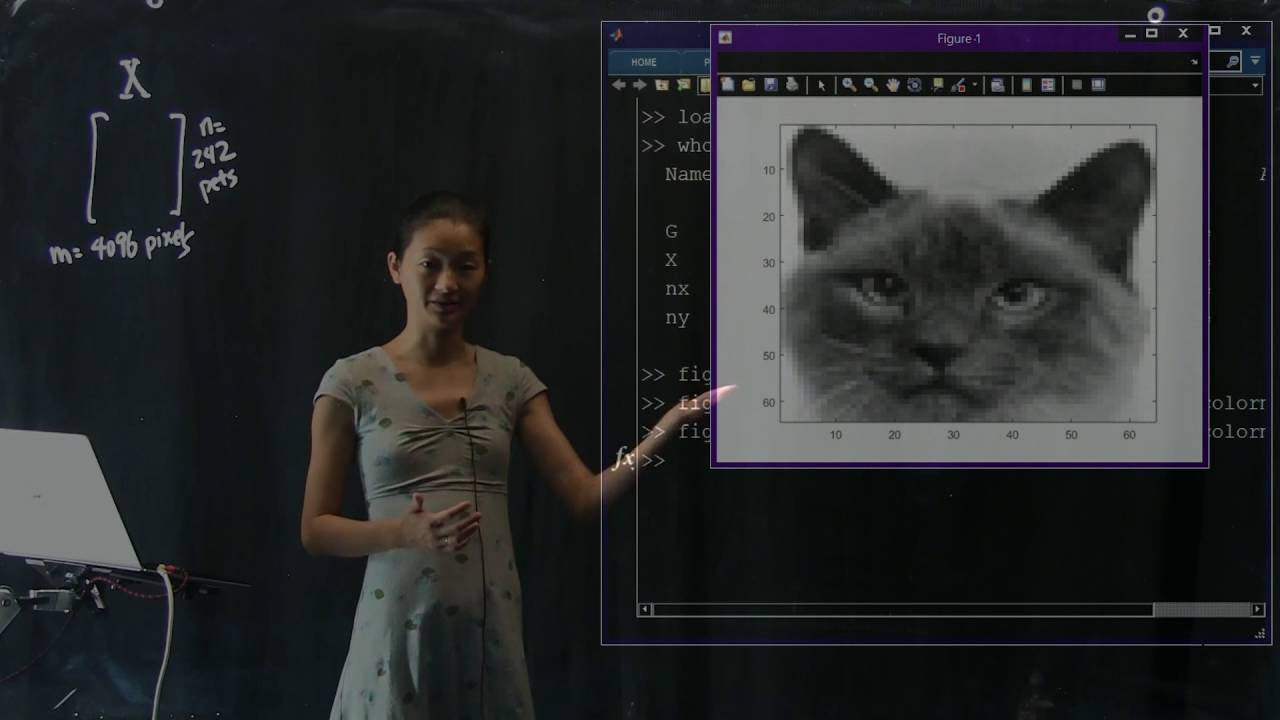
Now, let’s take a closer look at a few examples from this dataset. Imagine we’re sifting through a pile of pet photos, observing their unique features. Here’s one image of a cat – its eyes and pointy ears take the center stage. With each image, we’re reminded of the diversity within the same species.
Now, let’s move on to another image. This one showcases a different cat, revealing variations in fur color. Some have light-colored fur, while others have dark-colored fur. Notice that even though we’ve aligned and cropped the images, we haven’t normalized them for fur color. This variability in color adds to the richness of our dataset.
Next, let’s explore the canine side of things. Here’s an image of a dog – a faithful companion with its distinct features. Keep in mind that these images are pre-aligned, allowing us to focus on specific characteristics, such as their eyes and noses.
By delving deeper into the dataset, we come across another dog image. This time, it’s a different breed with a contrasting coat color. The grayscale images capture the essence of each pet, showcasing their uniqueness.
Unleashing the Power of Dimensionality Reduction
Now that we’ve acquainted ourselves with the dataset, let’s tackle the ultimate goal of image recognition. Imagine being able to identify whether a new image is of a cat or a dog. To achieve this, we need to first gain a deeper understanding of our dataset.
Our journey begins with dimensionality reduction, specifically using a technique called Principal Components Analysis (PCA). By applying PCA, we aim to extract the essential features that differentiate cats from dogs. However, before diving into the details, let’s venture into the exciting realm of eigenpets!
Stay tuned for Part 2 of “Dimensionality Reduction: Eigenpets,” where we’ll embark on a captivating exploration of PCA and unravel the mysteries hidden within our pet images.
To learn more about the fascinating world of technology, make sure to check out Techal, a leading source of tech news and insights.
Until next time, keep exploring and unraveling the secrets of data!
