Welcome to the world of design matrices and linear models! In this article, we’ll explore the concept of design matrices and their role in general linear models. This is Part Three of our series, so if you haven’t caught up with the previous parts, now might be a good time to do so.
Contents
What are Design Matrices?
Design matrices are an essential component of linear models in statistical analysis. They allow us to represent relationships between variables and make meaningful predictions. Think of them as a set of numbers that we can plug into an equation to analyze data.

The Standard Design Matrix for a T-Test
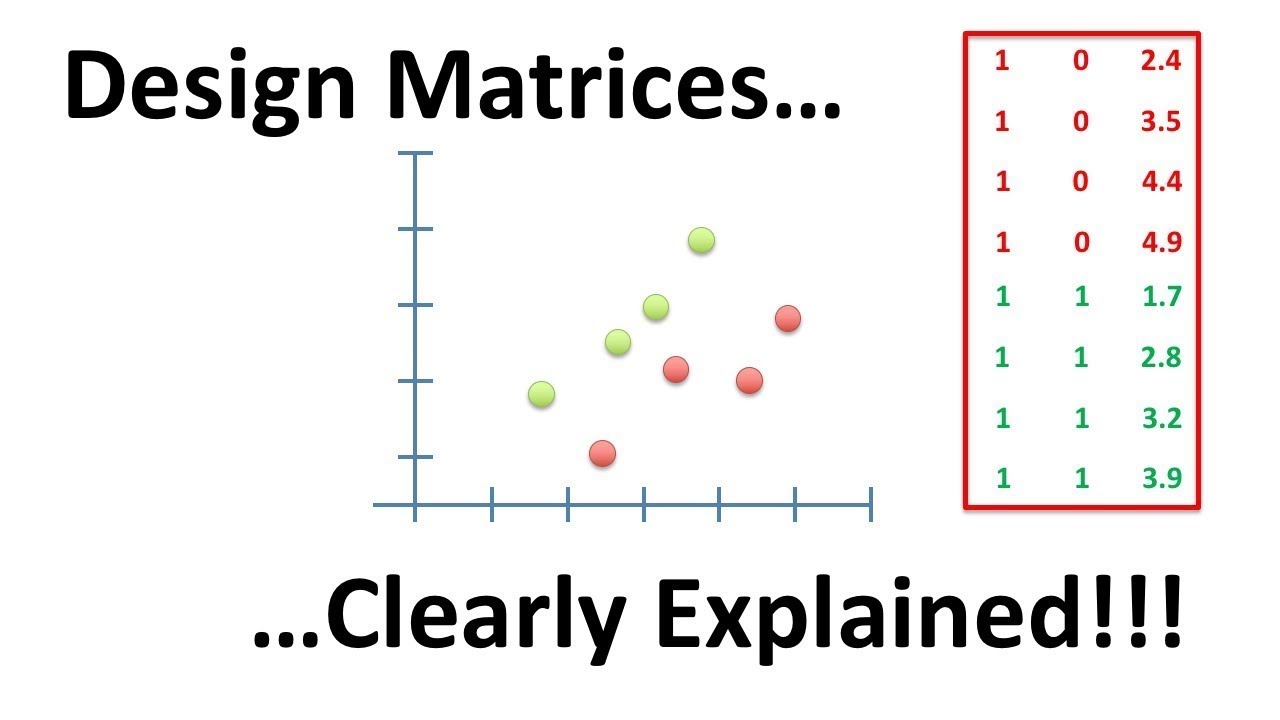
Let’s start by looking at the standard design matrix for a t-test. This matrix helps us compare the means of two different categories of data. It consists of ones and zeros, where ones indicate the presence of a certain category and zeros indicate its absence.

In this matrix, the first column represents the mean control value, while the second column represents the difference between the mean of the mutant data and the mean of the control data. By multiplying these values with the corresponding terms in the equation, we can analyze the data and calculate the residuals.
Design Matrices for Linear Regression
Design matrices are not limited to just ones and zeros. They can also include other numbers to represent various relationships between variables. For example, in linear regression, we use design matrices to analyze the relationship between an independent variable (x-axis position) and a dependent variable (y-intercept and slope).

In this matrix, the first column represents the y-intercept, and the second column represents the x-axis position. By plugging in the values from the matrix into the equation, we can calculate the least squares fit line and the residuals.
Combining T-Tests and Regression
What if we want to combine a t-test and regression to analyze data that includes multiple variables? Design matrices can help us achieve that as well. Let’s say we want to compare the sizes of two types of mice, taking their weight and mouse type into account.

In this matrix, the first column represents the y-intercept for the normal mice, the second column represents the presence or absence of the mutant offset, and the last column represents the weight data. By plugging in the values for each row, we can calculate the coordinates on either the red line (mutant offset off) or the green line (mutant offset on). This allows us to compare the fancy model (including weight and mouse type) to a simpler model (ignoring weight and mouse type) and analyze the residuals to determine significance.
Handling Batch Effects
Design matrices can also help us tackle batch effects in data analysis. Suppose we have two sets of data from different labs, and we want to compare the expression levels of mutants and controls while accounting for the batch effect.

In this matrix, the first column represents the mean control value from Lab A, the second column represents the Lab B offset, and the third column represents the differences between the mutant and control measurements. By comparing the fit of the fancy equation (including the control-mutant differences) to a simpler equation (ignoring the control-mutant differences), we can determine if the differences are significant.
FAQs
Q: What are design matrices?
A: Design matrices are a set of numbers that we can plug into an equation to represent relationships between variables in statistical analysis.
Q: What is the standard design matrix for a t-test?
A: The standard design matrix for a t-test consists of ones and zeros, where ones represent the presence of a certain category, and zeros represent its absence.
Q: Can design matrices include numbers other than ones and zeros?
A: Yes, design matrices can include other numbers to represent relationships between variables, such as in linear regression.
Q: How can design matrices help handle batch effects?
A: Design matrices can be used to account for batch effects by including terms that represent the differences between measurements from different batches.
Conclusion
Design matrices play a crucial role in analyzing data using linear models. They allow us to represent relationships between variables and make predictions. Whether it’s comparing means, conducting linear regression, or accounting for batch effects, design matrices provide a powerful tool for data analysis. Stay tuned for more exciting stat quests! If you have any specific design matrices or topics you’d like us to explore, let us know in the comments below. Visit Techal for more insightful articles on the ever-evolving world of technology.
