Are you ready to dive into the fascinating world of Principal Component Analysis (PCA)? In this article, we will explore how this technique can be used for dimensionality reduction, a crucial aspect of statistics and data analysis. While we can’t cover everything in a single article (there’s over a century’s worth of research and literature on this topic), we will walk through the basics and showcase some data examples to get you started.
Contents
The Magic of PCA
Imagine having a dataset with many variables, making it complex and difficult to analyze. This is where PCA comes in. PCA allows us to find the most important features in our data, simplifying it and making it more manageable. By computing the Singular Value Decomposition (SVD), we can extract the principal components (the directions of maximum variance) and use them to understand the distribution and statistics of our data.
Let’s dive into a couple of data examples to see it in action!
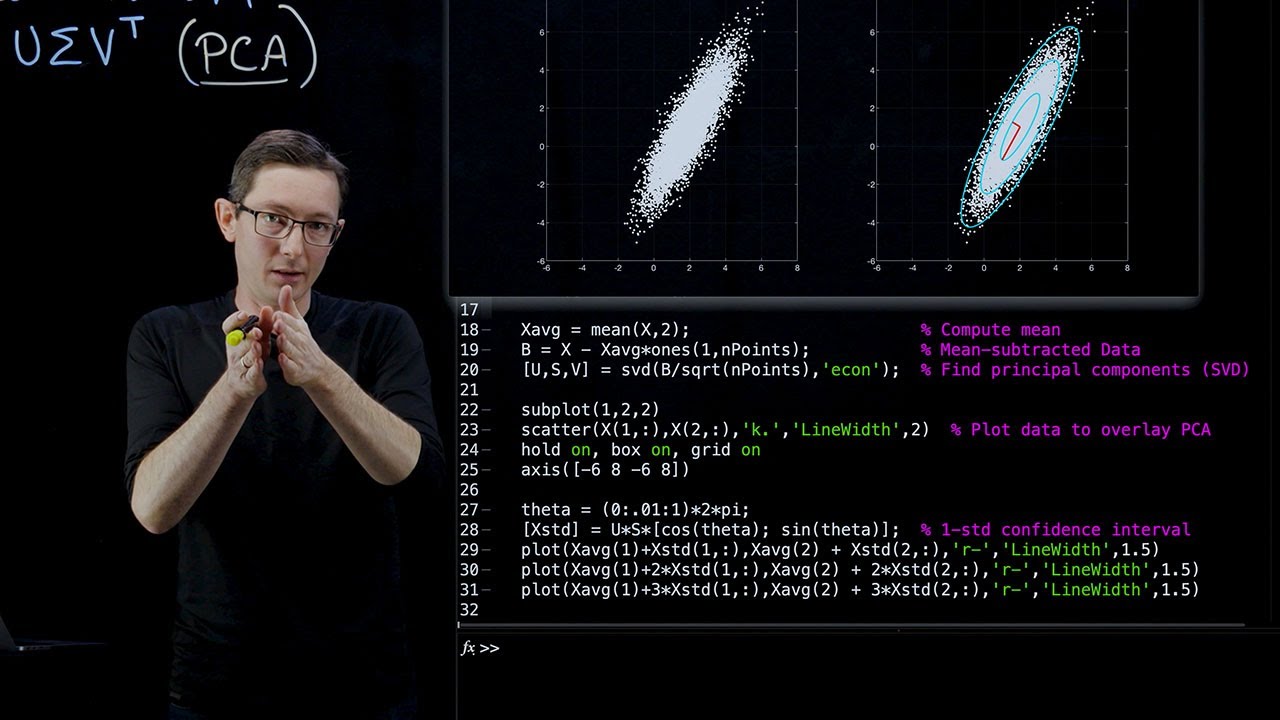
Dataset 1: Manufacturer Data
In this first example, let’s consider a manufactured dataset. Although it’s a simple example, it’s an excellent way to understand the inner workings of PCA. We will generate a dataset with random variation, including factors like mean, variance, and rotation. By applying PCA, we will be able to uncover the principal directions of variance.
Dataset 2: Ovarian Cancer Markers
Now, let’s move onto a real-world dataset. This dataset focuses on genetic markers correlated to ovarian cancer. We have information about 216 patients, with each patient having 4,000 genetic markers. Our goal is to identify the genetic markers that are highly correlated with ovarian cancer, which is not an easy task with such high-dimensional data.
This is where PCA comes to the rescue! By applying PCA to this dataset, we can plot the first three eigen-genetic sequences and identify any patterns or clusters that might emerge. This visualization technique helps us understand the dataset better, even when dealing with high-dimensional data.
Unveiling the Power of PCA
PCA gives us a powerful tool for visualizing and analyzing high-dimensional data. Instead of struggling with thousands of variables, we can extract the dominant features and work with a lower-dimensional representation. This not only simplifies the analysis but also allows us to discover patterns and correlations that might not be immediately visible in the original dataset.
By computing the SVD and studying the singular values, we can determine the amount of variance captured by each principal component. This information helps us understand which components are the most informative and which ones can be safely ignored.
Conclusion
Principal Component Analysis (PCA) is a powerful technique for analyzing and visualizing high-dimensional data. By applying the SVD and extracting the principal components, we can uncover the most important features and understand the distribution and statistics of the data. Whether you’re working with manufactured datasets or real-world genetic data, PCA provides valuable insights that can help you make sense of complex information.
Ready to explore the world of PCA further? Check out Techal for more exciting articles on information technology and data analysis!
